
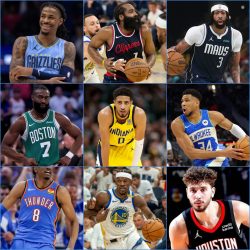
Giannis Antetokounmpo, Kristaps Porzingis and Victor Oladipo are having banner years where they’ve upped their scoring averages by approximately 7 points per game — that’s not insignificant, but where do those increases sit in NBA history?
That got us wondering which NBA players have improved their scoring averages the most from one season to the next.
The way some players improved their scoring averages are comparable to a basketball video game — something akin to shooting every time with your favorite player in NBA2K or playing basketball star online slot – nothing but wins.
In reality, the following list isn’t a video game. These players had the biggest jumps in scoring in the best basketball league in the world. On top of that, these players didn’t change teams and still improved their scoring. We found that looking at the reasons why a player improved so much, we saw that they fell into a combination of three categories: gaining more experience (going from rookie to Sophomore for example), a big jump in minutes per game, and/or took on a bigger role with the team.
Without more words to be said, here are the players that have improved their scoring averages the most while playing for the same team.
| Jump | Player | Season | PPG | Prior | Team | What Happened? |
|---|---|---|---|---|---|---|
| +14.0 | C.J. McCollum | 2015-16 | 20.8 | 6.8 | Portland Trailblazers | nearly 20+ mpg |
| +13.2 | Jerry West | 1961-62 | 30.8 | 17.6 | Los Angeles Lakers | Rookie to Sophomore |
| +12.6 | Bob McAdoo | 1973-74 | 30.6 | 18.0 | Buffalo Braves | Rookie to Sophomore |
| +12.2 | Nate Archibald | 1971-72 | 28.2 | 16.0 | Cincinnati Royals | Rookie to Sophomore |
| +12.0 | Wilt Chamberlain | 1961-62 | 50.4 | 38.4 | Philadelphia Warriors | 2nd Year to 3rd |
| +11.7 | Zach Randolph | 2003-04 | 20.1 | 8.4 | Portland Trailblazers | 21+ mpg |
| +11.0 | Michael Adams | 1990-91 | 26.5 | 15.5 | Denver Nuggets | 5th to 6th year |
| +10.9 | Jim Paxson | 1980-81 | 17.1 | 6.2 | Portland Blazers | Rookie to Sophomore |
| +10.0 | Antawn Jamison | 1999-00 | 19.6 | 9.6 | Golden State Warriors | Rookie to Sophomore |
| +9.9 | Rick Barry | 1966-67 | 35.6 | 25.7 | San Francisco Warriors | Rookie to Sophomore |
| +9.4 | Kevin Martin | 2006-07 | 20.2 | 10.8 | Sacramento Kings | 2nd to 3rd Year |
| +9.3 | Dirk Nowitzki | 1999-00 | 17.5 | 8.2 | Dallas Mavericks | Rookie to Sophomore |
| +9.1 | Jerry Stackhouse | 1999-00 | 23.6 | 14.5 | Detroit Pistons | +10 minutes per game |
| +8.8 | LaMarcus Aldridge | 2007-08 | 17.8 | 9.0 | Portland Trailblazers | Rookie to Sophomore |
| +8.6 | Reggie Miller | 1989-90 | 24.6 | 16.0 | Indiana Pacers | 3rd to 4th year |
| +8.6 | DeMar Derozan | 2010-11 | 17.2 | 8.6 | Toronto Raptors | Rookie to Sophomore |
| +8.4 | Gail Goodrich | 1971-72 | 25.9 | 17.5 | Los Angeles Lakers | 6th year to 7th |
| +8.3 | Devin Booker | 2016-17 | 22.1 | 13.8 | Phoenix Suns | Rookie to Sophomore |
| +8.2 | Stephen Curry | 2012-13 | 22.9 | 14.7 | Golden State Warriors | 3rd to 4th year |
| +8.1 | Russell Westbrook | 2016-17 | 31.6 | 23.5 | Oklahoma City Thunder | 8th to 9th year |
| +8.1 | Al Jefferson | 2006-07 | 16.0 | 7.9 | Boston Celtics | 2nd to 3rd (+15mpg) |
| +8.0 | World B. Free | 1976-77 | 16.3 | 8.3 | Philadelphia 76ers | Rookie to Sophomore |
| +7.9 | Dwyane Wade | 2004-05 | 24.1 | 16.2 | Miami Heat | Rookie to Sophomore |

It’s interesting to note that each one of these players, except Kevin Martin and a couple of the younger players (McCollum and Booker), have been selected to an NBA All-Star Game.
FYI, we didn’t include players that had injury-plagued seasons and then came back to score more a la Michael Jordan‘s 1985-86 season where he played 18 games and averaged 22.7 and then came back with a vengeance by leading the league in scoring the next year with 37.1 points (14.4+). A quick rule of thumb is if a player played double the amount of games from the previous season, then we didn’t include them in the list.
That’s more an anomaly due to MJ’s injury than anything else mostly because Jordan averaged 28+ points prior to that injury season. Same goes with players that averaged 3 points one season and then averaged 11 the next — we see that as a more a product of minutes than anything else.
The Biggest Scoring Jumps After Trade/Team Change
We’ve decided to isolate this first list of players to those that haven’t changed teams. For players that improved their scoring by 9 or more points after switching teams, stay tuned. We’re going to update this post with players that increased their scoring averages after being traded as we discover more players.
| Increase | Player | Season | PPG | Prior | New Team | Previous Team |
|---|---|---|---|---|---|---|
| +17.8 | Dale Ellis | 1986-87 | 24.9 | 8.1 | Seattle Supersonics | Dallas Mavericks |
| +17.0 | Tony Campbell | 1989-90 | 23.2 | 6.2 | Minnesota Timberwolves | Los Angeles Lakers |
| +13.1 | World B. Free | 1978-79 | 28.8 | 15.7 | Philadelphia 76ers | San Diego Clippers |
| +12.7 | Larry Hughes | 1999-00 | 22.7 | 10.0 | Philadelphia 76ers | Golden State Warriors |
| +11.4 | Tracy McGrady | 2000-01 | 26.8 | 15.4 | Orlando Magic | Toronto Raptors |
| +10.0 | Gail Goodrich | 1968-69 | 23.8 | 13.8 | Los Angeles Lakers | Phoenix Suns |
| +9.3 | Dorell Wright | 2010-11 | 16.4 | 7.1 | Miami Heat | Golden State Warriors |
| +9.1 | James Harden | 2012-13 | 25.9 | 16.8 | Houston Rockets | Oklahoma City Thunder |
So Dale Ellis takes the cake on this one. After playing about 15 minutes in 72 games off the bench for the Dallas Mavericks during the 1985-86 season. He was then traded in the off-season to the Seattle Supersonics for 6-foot-6 veteran guard Al Wood. In Dallas, it was hard to find minutes for the young shooter as he was stuck behind Mark Aguirre, Jay Vincent and Detlef Schrempf. “This is the opportunity I’ve been waiting for… This is an opportunity to show my skill and develop it to its fullest.” Ellis said at a conference announcing the trade.” In Seattle, his opportunity translated to playing 37 minutes a a game for all 82 games, and averaged an unbelievable 24.9 points per game which was 17.8 points above his 8.1 average the previous season.
It’s worth mentioning that though Tony Campbell increased his output by an eye-opening 17 points, it’s not nearly as impressive as what Ellis did. That’s because Campbell was a role player averaging 6.2 points in 62 games with the Lakers before jumping to averaging 23.2 points after being chosen by the Minnesota Timberwolves in the expansion draft. Before Campbell averaged those 6.2 points, Campbell put up 11 points per game for the Lakers.
And his increased scoring is less-amazing considering it was accomplished on an expansion team. Listen, we’re not saying it’s easy to score in the NBA, but in the context of this list, Campbell had a few more things in his favor when he increased he did nearly tripled his scoring average.
The list above mostly has players that were traded in the offseason, but also includes mid-season trades, but the amount of games had to be significant enough of a sample size to include. An example of a midseason trade we included in the list was Larry Hughes. The lanky scoring guard played all 82 games in the 1999-2000 season, 50 for the Sixers and 32 for the Warriors after being traded.
We also didn’t include players that rarely played one season and then got significantly more minutes the next. An example of that was Jeremy Lin‘s 12 point increase in the 2011-12 season after signing with the Knicks. In the previous season, he rode the bench for the majority of the season, stacking up DNPs and averaging just 2.6 points in garbage time. Obviously the next season would make a huge difference in his career, but it was too much of a difference to compare. If we were to include all those type of scenarios, the list would be much, much longer and not nearly as fun to look at.


Pingback: The NBA’s Most Underpaid Players | Kill That Noise
Pingback: Is Tyrese Maxey Making the Biggest Leap in NBA History? - The Ringer